
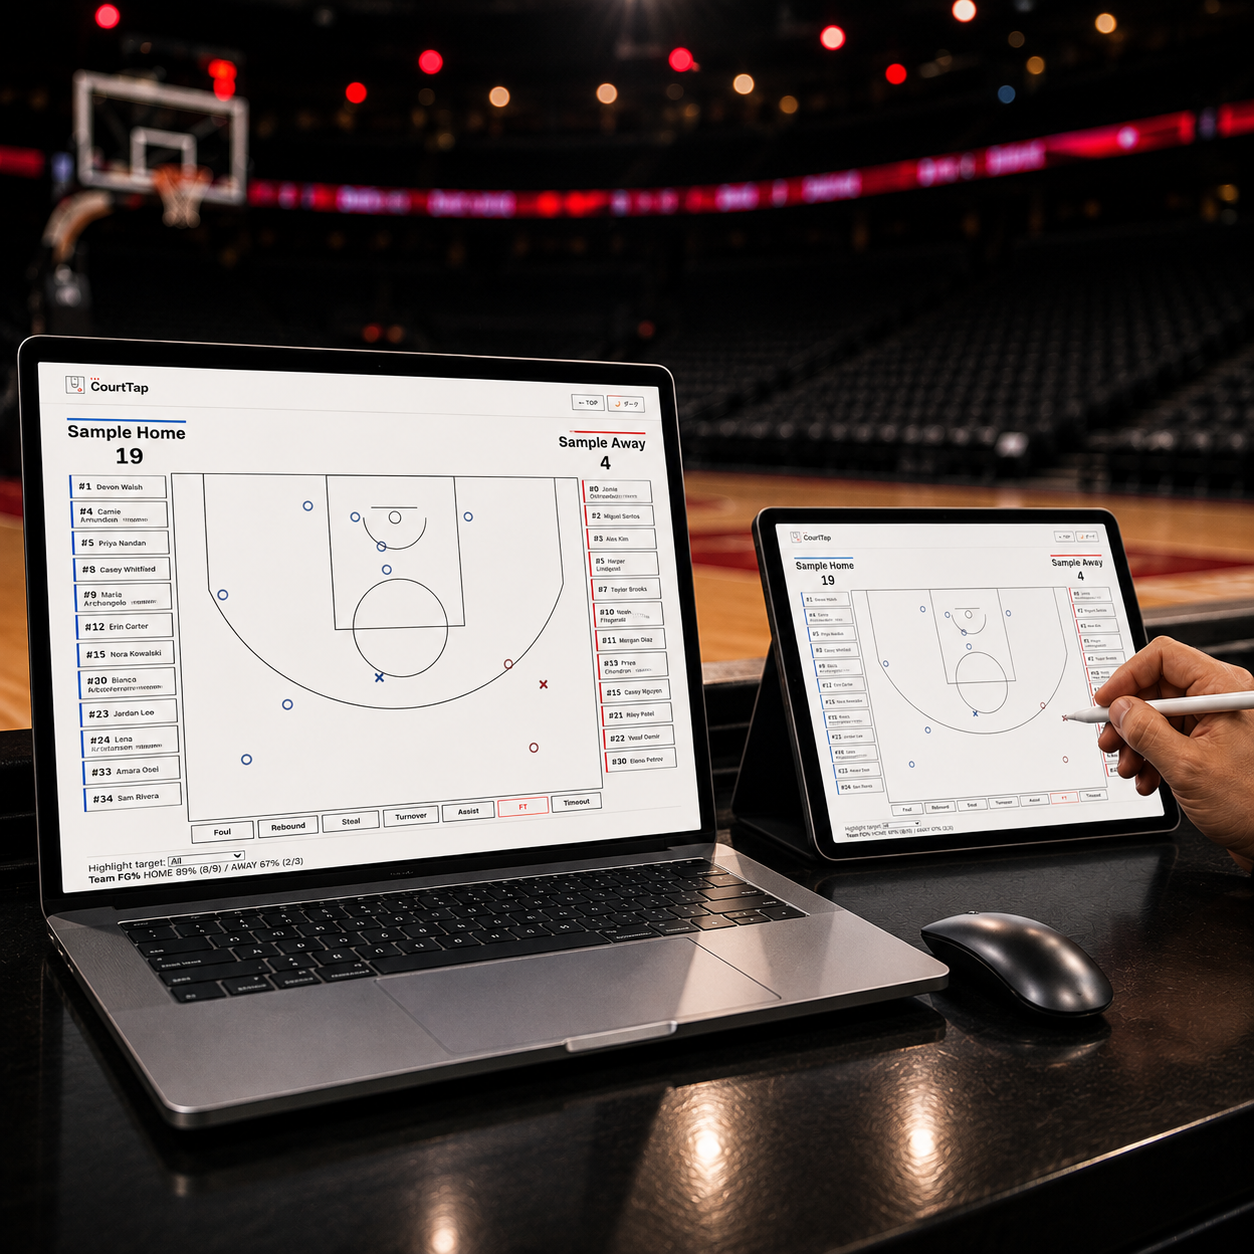
 For XPression
On PC or tablet. Record a basketball game, and it becomes XPression graphics — live.
Tap the court to record shot location and basic info. Score, game clock, and quarter stay on screen at all times — state lives on the server.
Score, rebounds, FG%, and the scorer ranking are reflected live via DataLinq — available as either JSON or CSV.
Just start the Node.js server on a Windows PC on your network. PC and tablet stay in sync in real time — through the browser alone.
The default court diagram works right out of the box. Set a single image URL and it can become a court carrying a sponsor's logo, your own venue's real court photo, or a team's custom design — any image you choose.
Tap the recording screen — the app guides you through the rest.
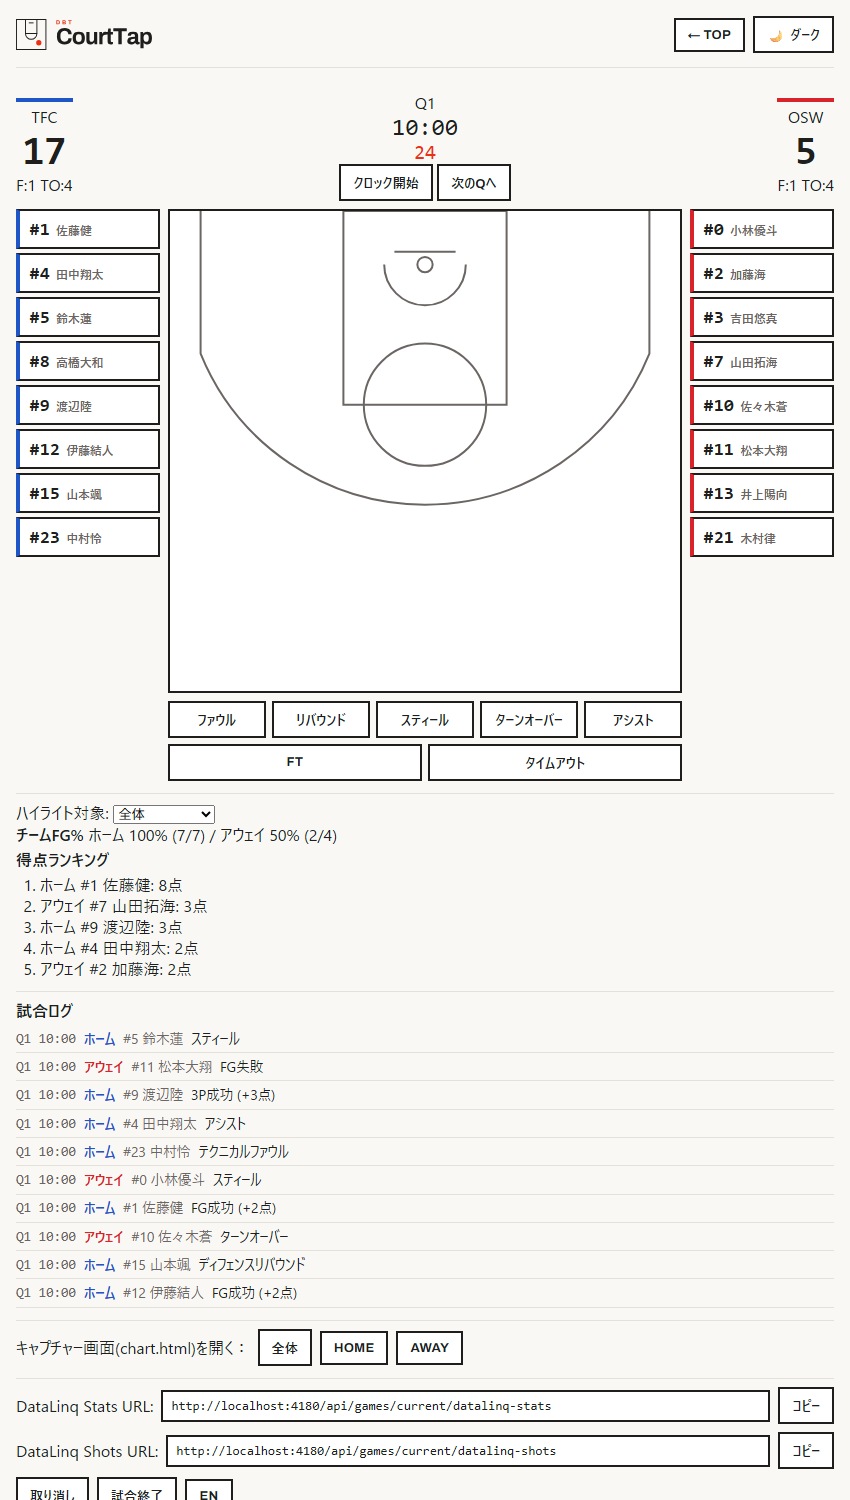
Score, game clock and quarter stay on screen at all times. State lives on the server, so a page reload never loses it.
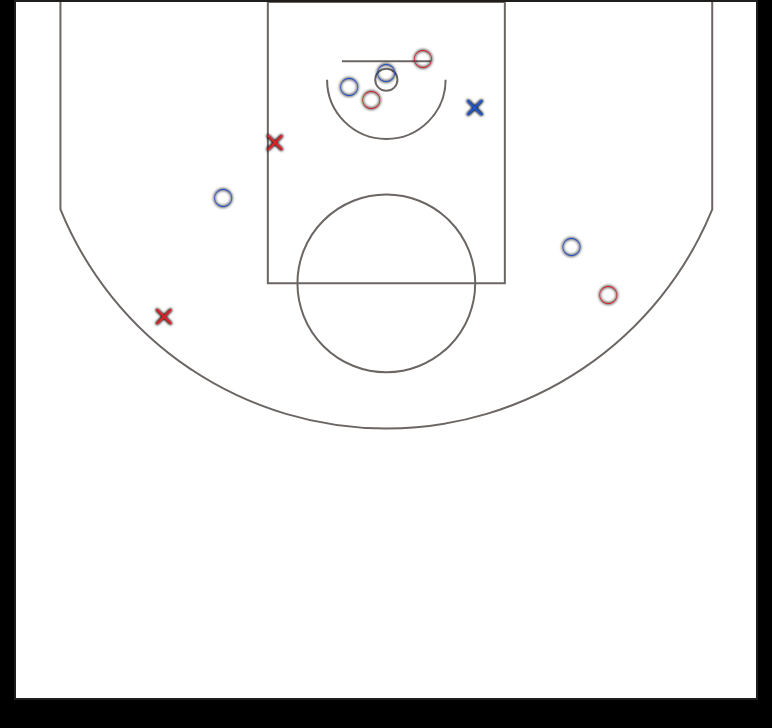
Tap anywhere on the half-court, and made/missed shots pile up on that same court in real time — just like a broadcast shot chart.
Foul, Rebound, Steal, Turnover, Assist, FT, Timeout — every stat is one tap away, and mistakes are one Undo away.
Whichever button you tap, the app walks you through the rest with a tap-to-choose panel. No typos, no ambiguity.
Rebounds, FG%, and the top-5 scorer ranking are all served live as JSON/CSV. Just point an XPression DataLinq Source at the URL.
A button-free, read-only screen with just the live Shot Chart on it. Bring it into XPression as video via a capture card or NDI.
Whichever button you tap on the recording screen — or the court itself — one of these opens.
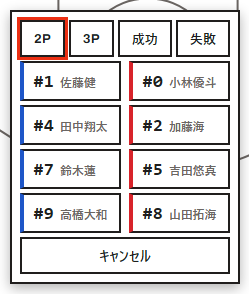
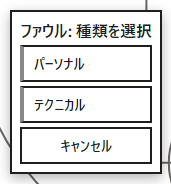
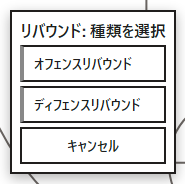
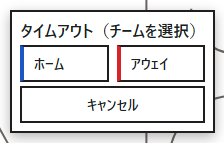
Steal, Turnover, and Assist are one step — just pick the player. Foul, Rebound, and Free Throw are two steps — pick the type, then the player.
You can also skip the post-shot assist confirmation, or switch to team-only recording for games without a roster set up.
Tap the court on the left, and it shows up live on the external-display output on the right.

A real, working app running in your browser (opens in a new tab)
Day to day, record from a laptop. Courtside, a tablet works just the same. It runs in a browser — no special app to install.
Team totals (rebounds, steals, turnovers, assists), team FG%, and the top-5 scorer ranking — all in one feed.
Field order stays stable in XPression DataLinq Server's Browse DataLinq dialog with Text (CSV) format. JSON is also available.
A button-free, capture-only Shot Chart screen (chart.html) — bring it into XPression as video via a capture card or NDI.
Unattended screens that display the scoring leaderboard and team stats directly as graphics (ranking.html / teamstats.html / stats.html). Pick from 4 designs × 4 backgrounds — no DataLinq scene needed to put it on air.
Unattended screens that show the scoring leaderboard and team stats as pre-designed graphics — always on. Use them standalone or combined on one screen. Chroma-key backgrounds included.
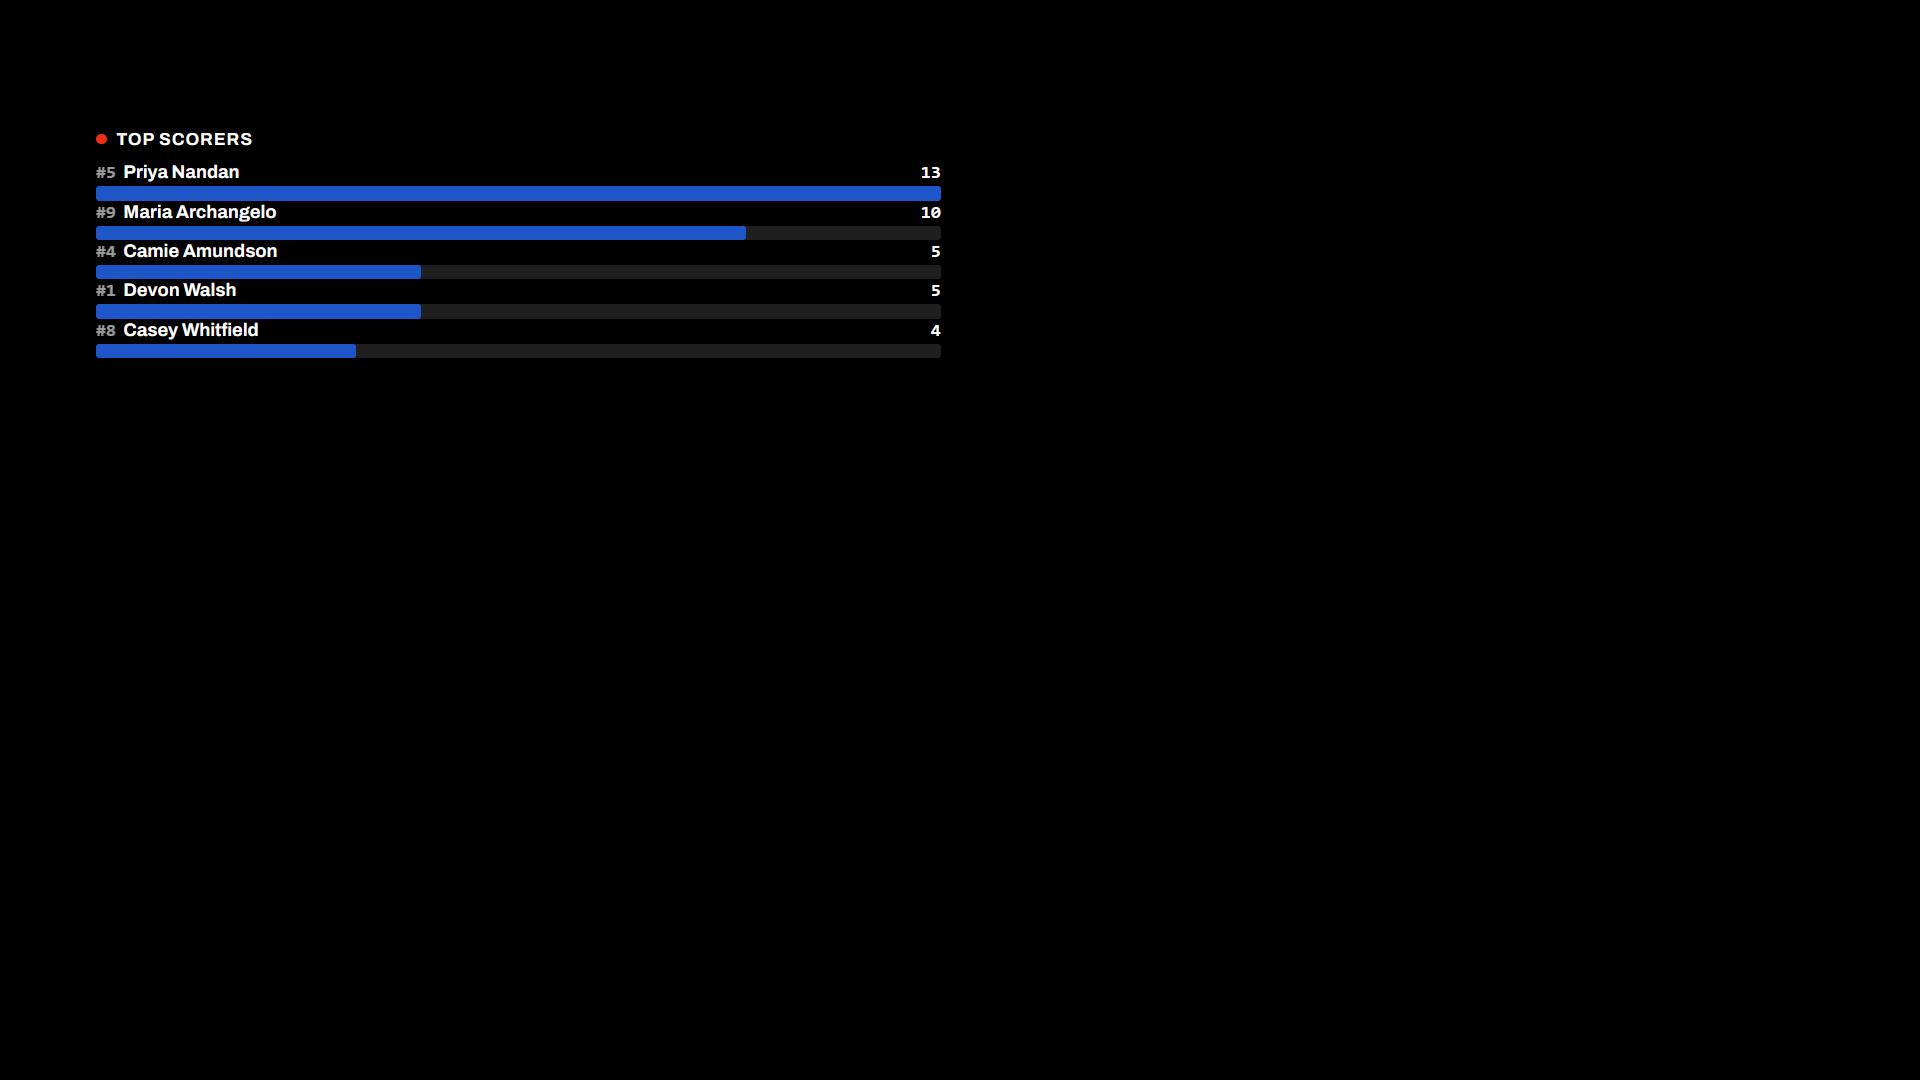
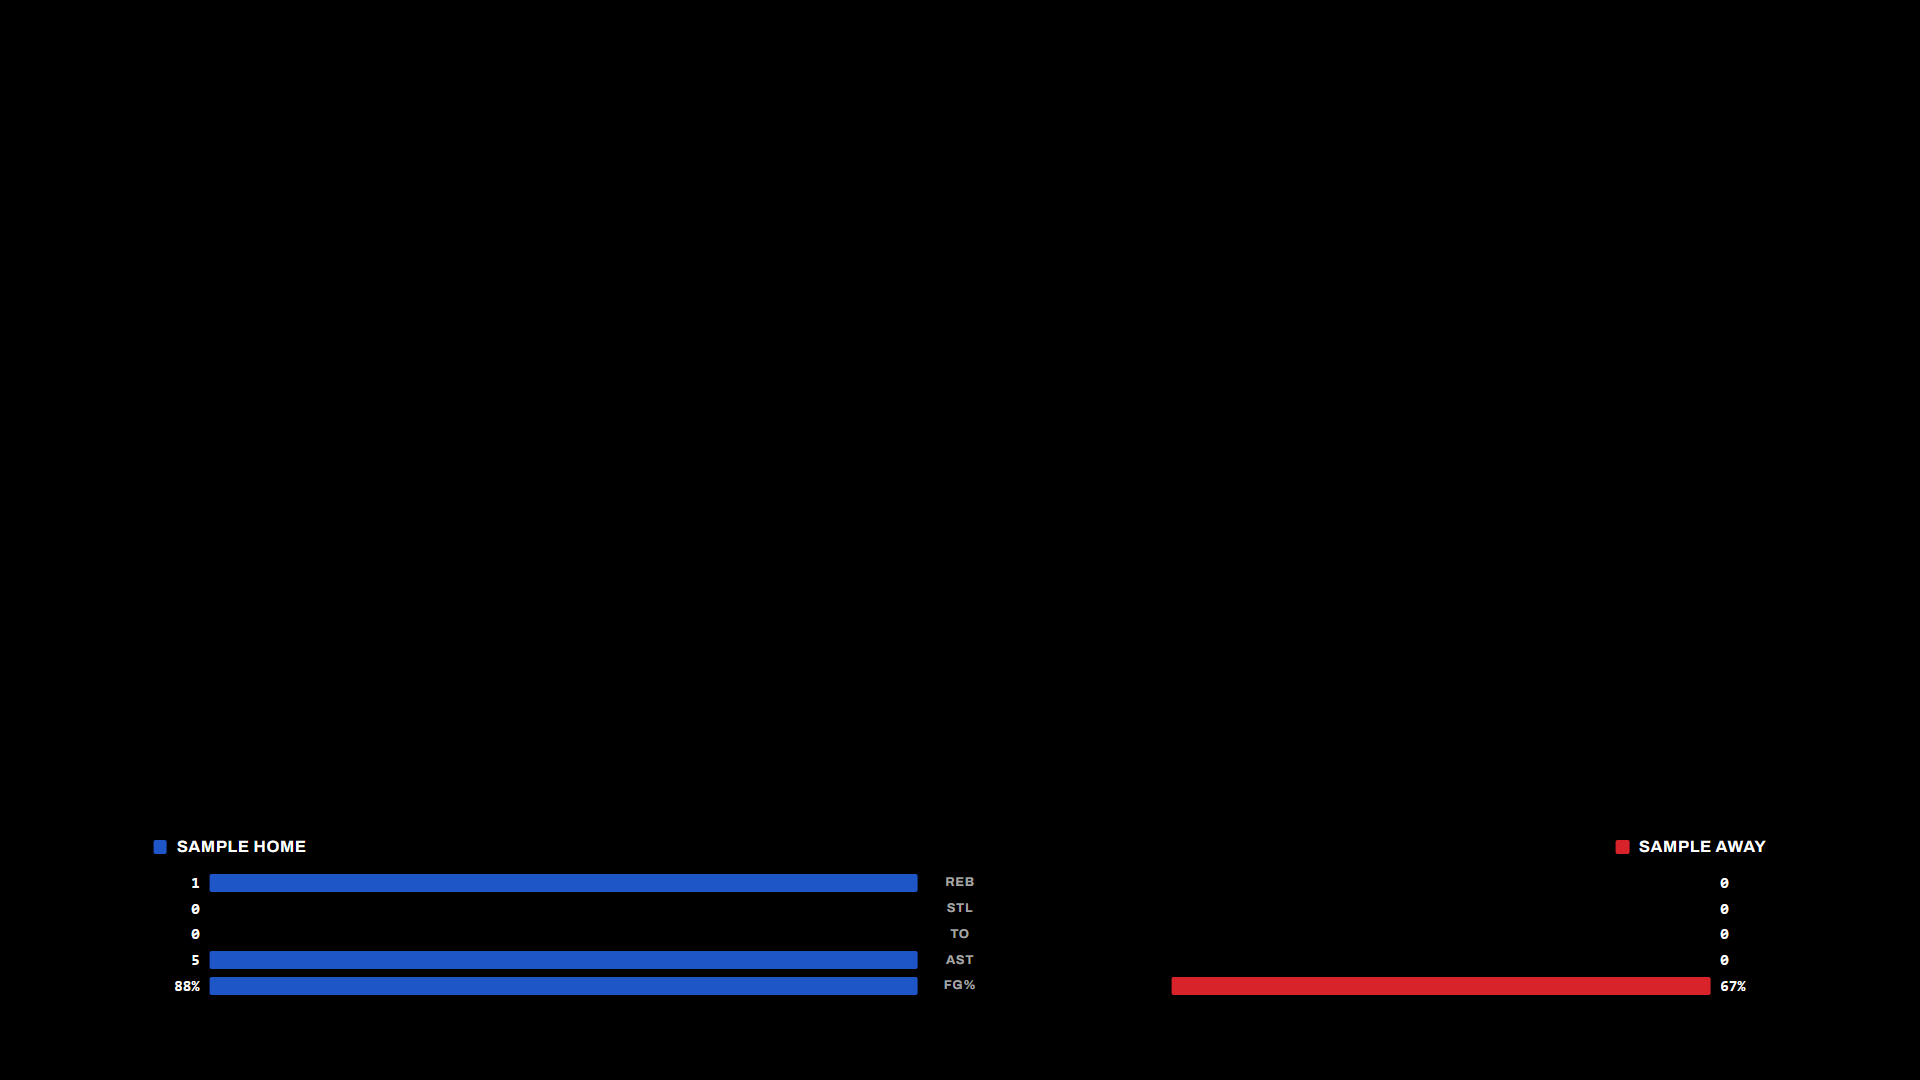
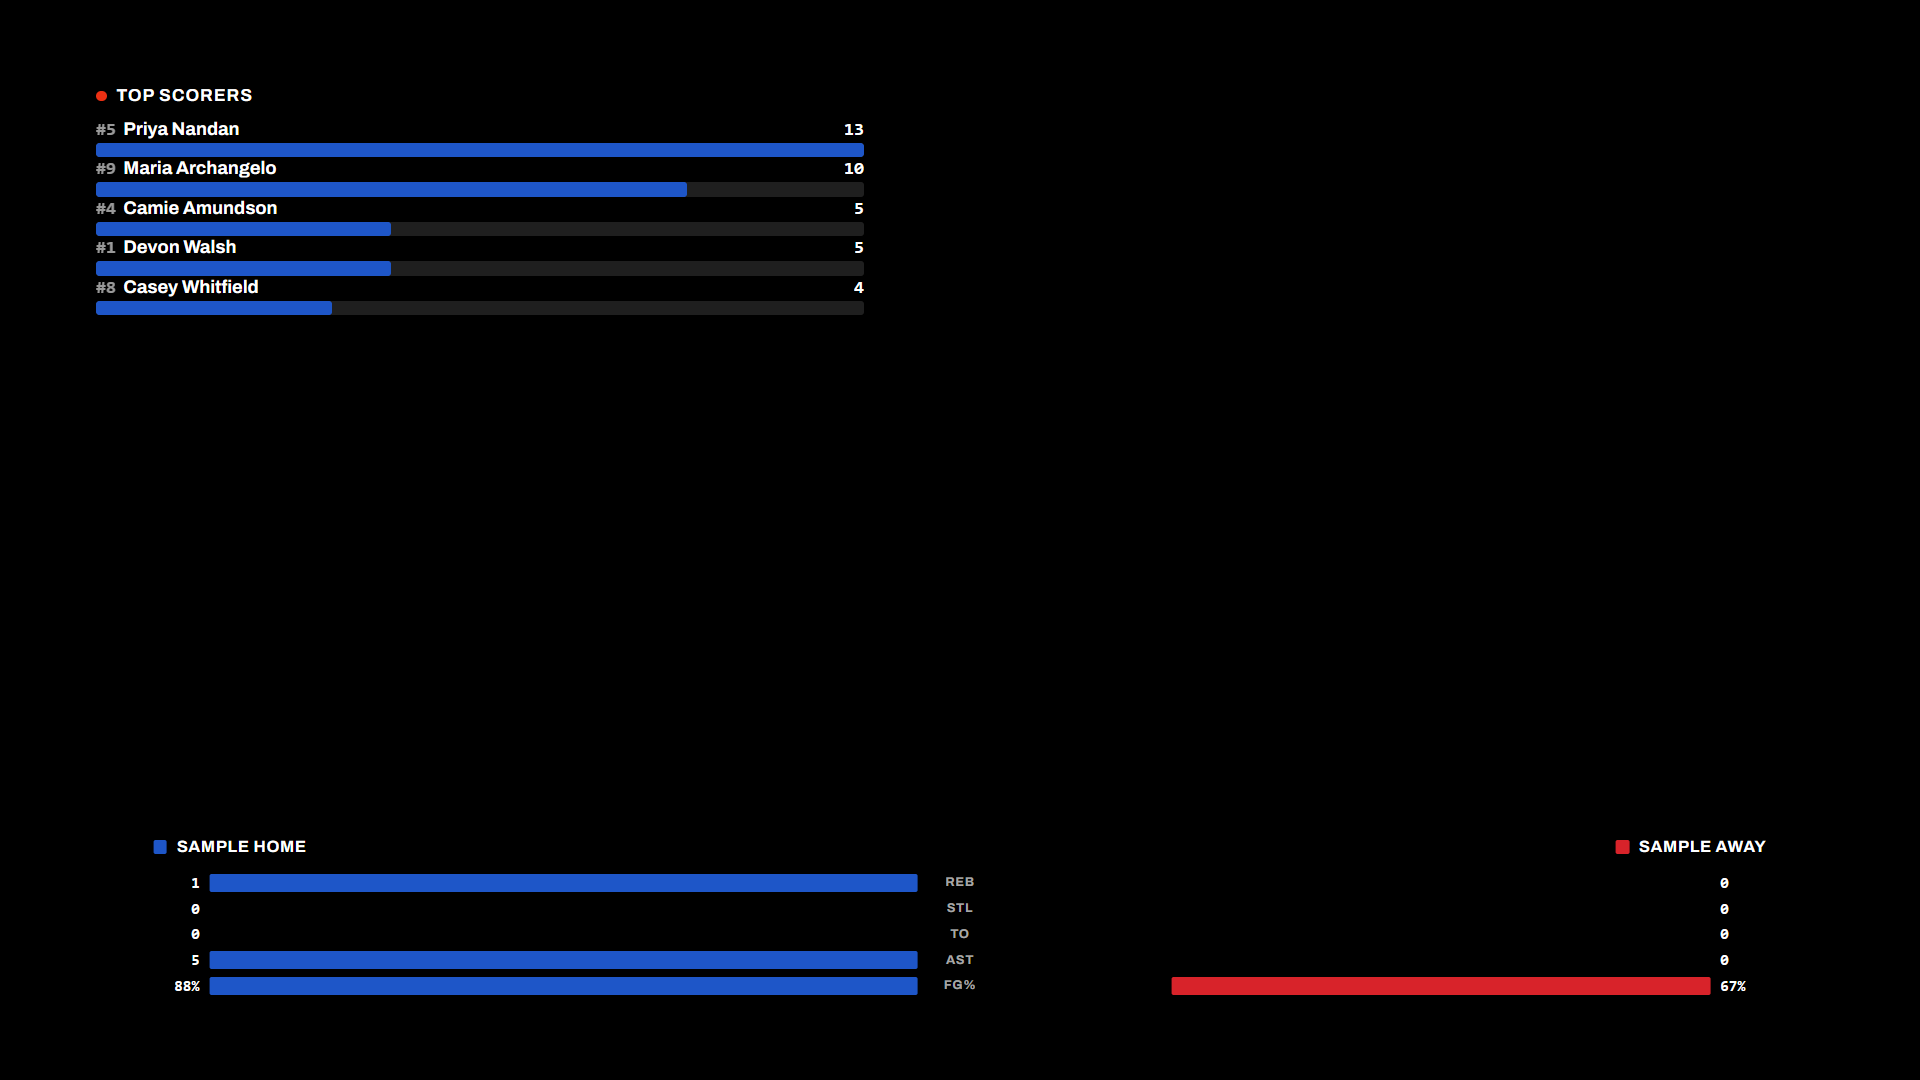
4 designs (Flat Bar / Card / Ticker / Minimal Dots) × 4 backgrounds (Solid Black / Transparent / Chroma Green / Chroma Blue). Color, size, and position can all be previewed live from the Live Input screen.
*Credit card payment (via Shopify) is billed in USD, so the charged amount may vary slightly with the exchange rate at checkout.
Reach out about using DBT CourtTap with your team or venue, or about XPression integration.